FastQC Tutorial & FAQ
FastQC, written by Simon Andrews of Babraham Bioinformatics, is a very popular tool used to provide an overview of basic quality control metrics for raw next generation sequencing data. There are a number different analyses (called modules) that may be performed on a sequence data set. By default the RTSF Genomics Core does not perform all these because some are redundant, do not provide significant meaningful information, or are more informative to the core facility than the end user. In addition to the information provided here, documentation is available online at the FastQC website.
The output from FastQC, after analyzing a FASTQ file of sequence reads, is an html file that may be viewed in your browser. The report contains one result section for each FastQC module. In addition to the graphical or list data provided by each module, a flag of “Passed”, “Warn” or “Fail” is assigned. Researchers should be very cautious about relying on these flags when assessing sequence data. The thresholds used to assign these flags are based on a very specific set of assumptions that are applicable to a very specific type of sequence data. Specifically, they are tuned for good quality whole genome shotgun DNA sequencing. They are less reliable with other types of sequencing, for example mRNA-Seq, small RNA-Seq, methyl-seq, targeted sequence capture and targeted amplicon sequencing. Therefore, a module result that has a “Warn” or “Fail” flag does not necessarily mean that the sequence run failed. “Warn” and “Fail” flags mean that the researcher must stop and consider what that results mean in the context of that particular sample and the type of sequencing that was run.
Parts of a standard FastQC report
An example FastQC report can be downloaded.
A PDF of this tutorial is available for download.
Basic Statistics
Simple information about input FASTQ file: its name, type of quality score encoding, total number of reads, read length and GC content.
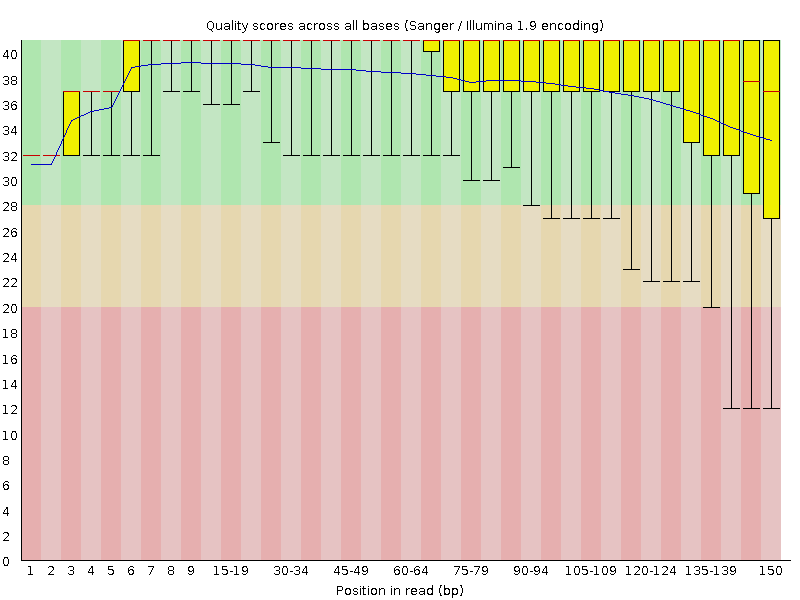
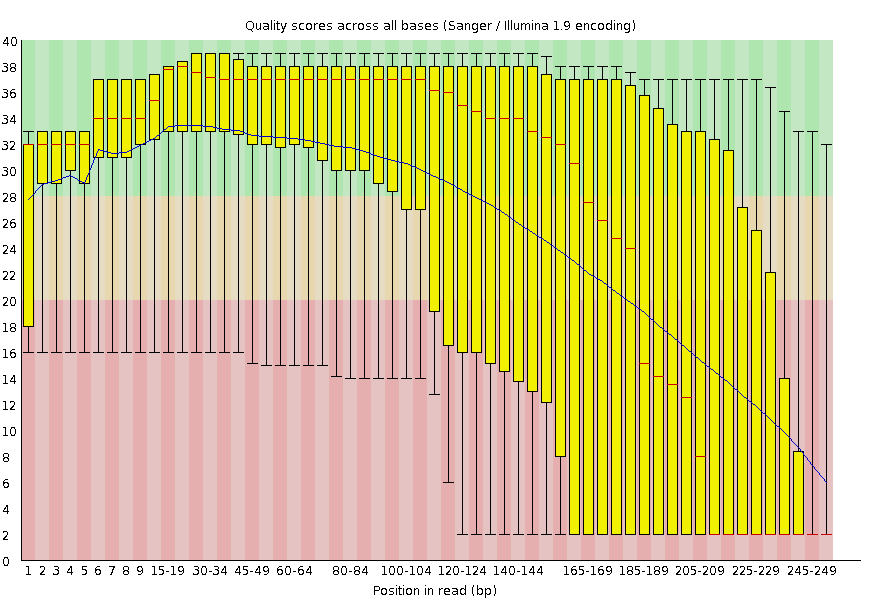
Per base sequence quality
A box-and-whisker plot showing aggregated quality score statistics at each position along all reads in the file. Note that the X-axis is not uniform, it starts out with bases 1-10 being reported individually, after that, it will bin bases across a window a certain number of positions wide. The number of base positions binned together depends on the length of the read; for example, with 150bp reads the latter part of the plot will report aggregate statistics for 5bp windows. Shorter reads will have smaller windows and longer reads larger windows. The blue line is the mean quality score at each base position/window. A primer on sequencing quality scores has been prepared by Illumina. The red line within each yellow box represents the median quality score at that position/window. Yellow box is the inner-quartile range for 25th to 75th percentile. The upper and lower whiskers represent the 10th and 90th percentile scores.
What to look for: It is normal with all Illumina sequencers for the median quality score to start out lower over the first 5-7 bases and to then rise. The average quality score will steadily drop over the length of the read. With paired end reads the average quality scores for read 1 will almost always be higher than for read 2.
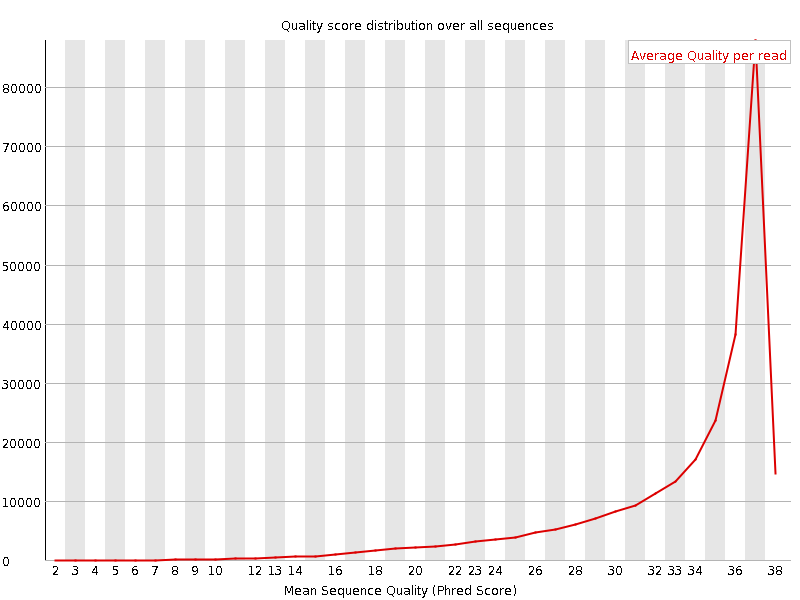
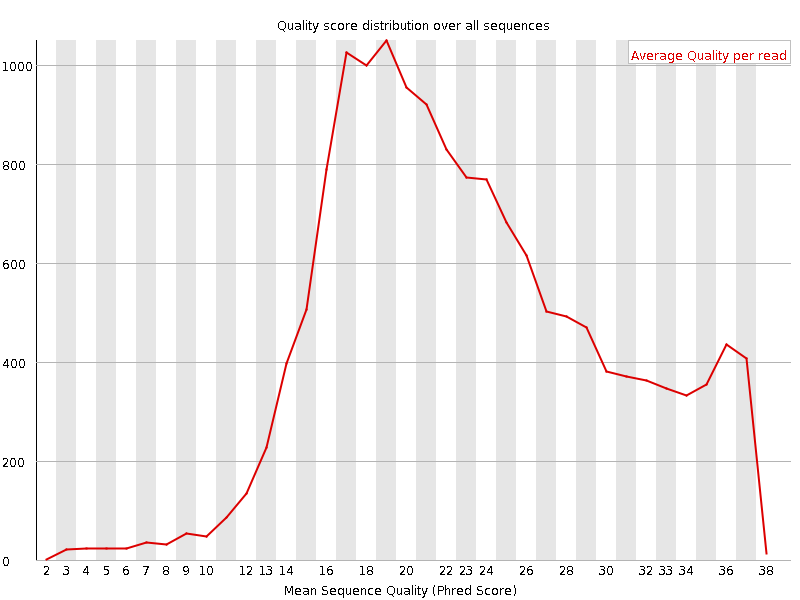
Per sequence quality scores
A plot of the total number of reads vs the average quality score over full length of that read.
What to look for: The distribution of average read quality should be fairly tight in the upper range of the plot.
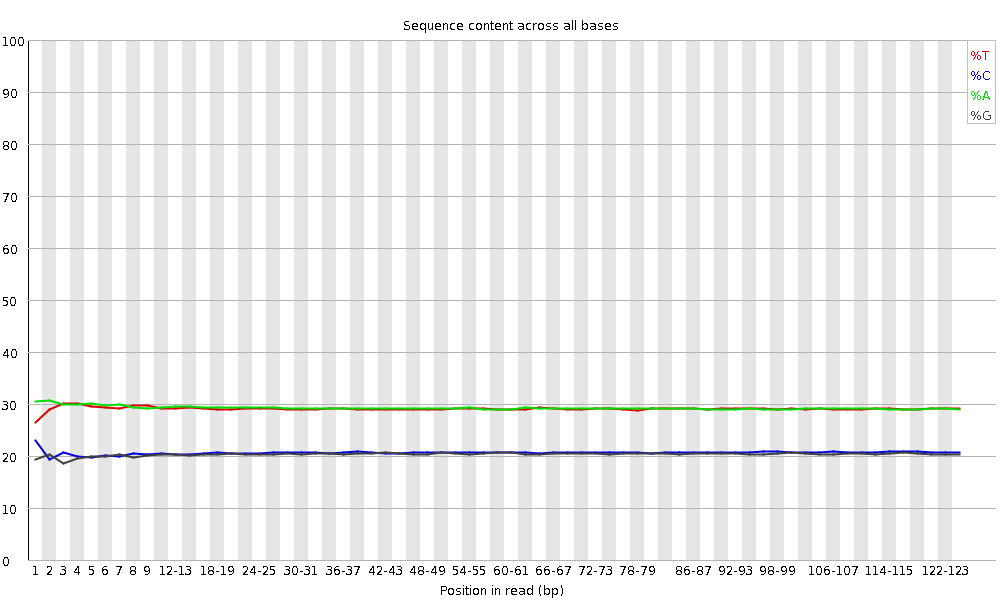
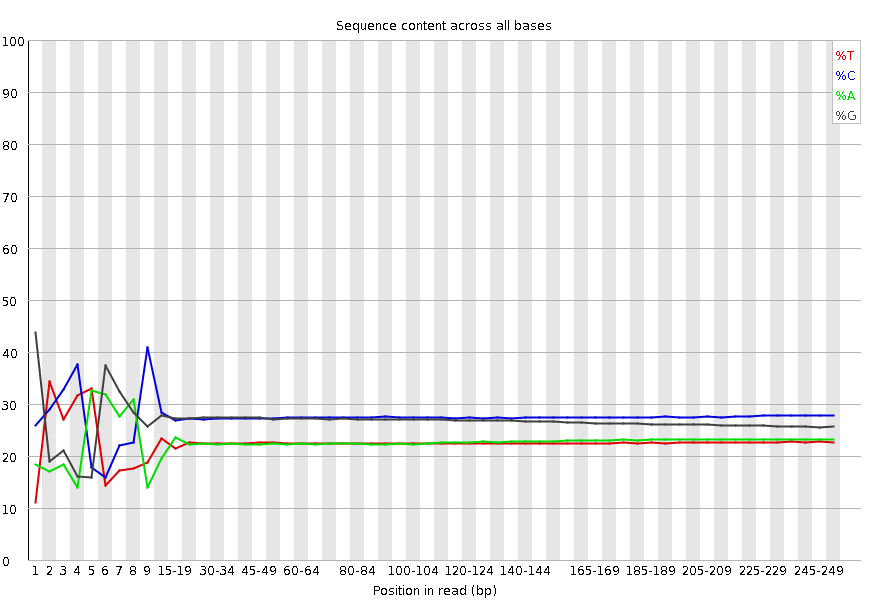
Per base sequence content
This plot reports the percent of bases called for each of the four nucleotides at each position across all reads in the file. Again, the X-axis is non-uniform as described for Per base sequence quality.
What to look for: For whole genome shotgun DNA sequencing the proportion of each of the four bases should remain relatively constant over the length of the read with %A=%T and %G=%C. With most RNA-Seq library preparation protocols there is clear non-uniform distribution of bases for the first 10-15 nucleotides; this is normal and expected depending on the type of library kit used (e.g. TruSeq RNA Library Preparation). RNA-Seq data showing this non-uniform base composition will always be classified as Failed by FastQC for this module even though the sequence is perfectly good.
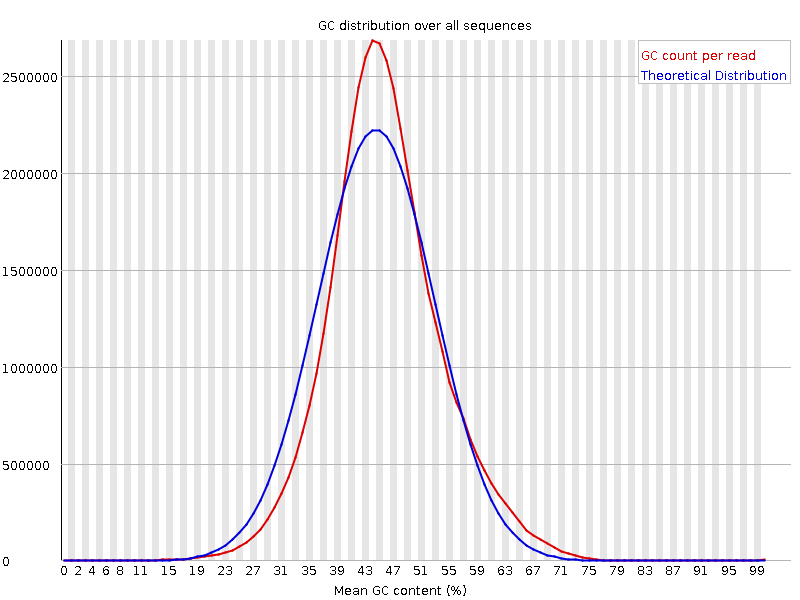
Per sequence GC content
Plot of the number of reads vs. GC% per read. The displayed Theoretical Distribution assumes a uniform GC content for all reads.
What to look for: For whole genome shotgun sequencing the expectation is that the GC content of all reads should form a normal distribution with the peak of the curve at the mean GC content for the organism sequenced. If the observed distribution deviates too far from the theoretical, FastQC will call a Fail. There are many situations in which this may occur which are expected so the assignment can be ignored. For example, in RNA sequencing there may be a greater or lesser distribution of mean GC content among transcripts causing the observed plot to be wider or narrower than an idealized normal distribution. The plot below is from some very high quality RNA-Seq data yet FastQC still assigned a Warn flag to it because the observed distribution was narrower than the theoretical.
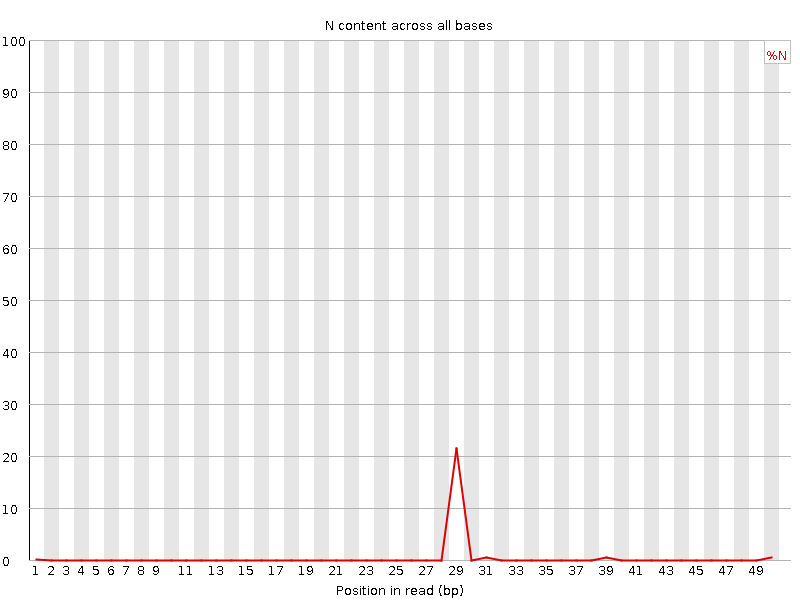
Per base N content
Percent of bases at each position or bin with no base call, i.e. ‘N’.
What to expect: You should never see any point where this curve rises noticeably above zero. If it does this indicates a problem occurred during the sequencing run. The example below is a case where an error caused the instrument to be unable to call a base for approximately 20% of the reads at position 29.
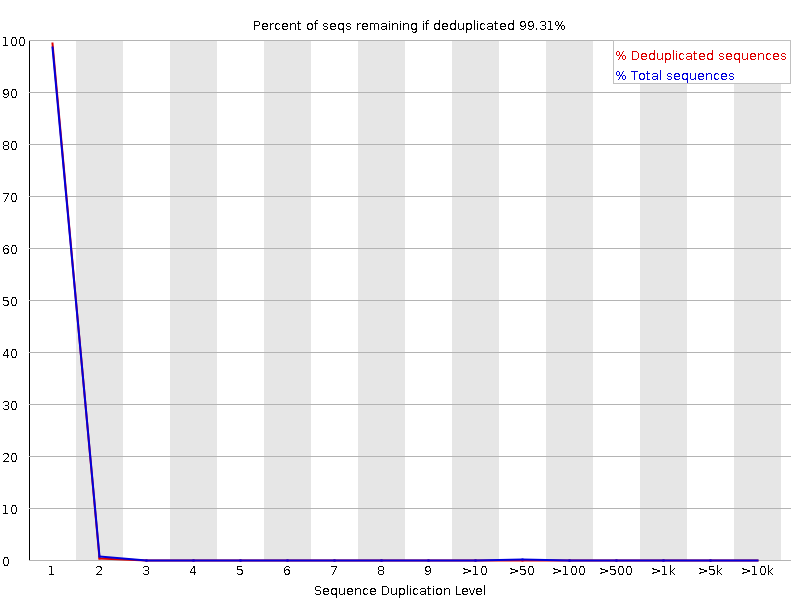
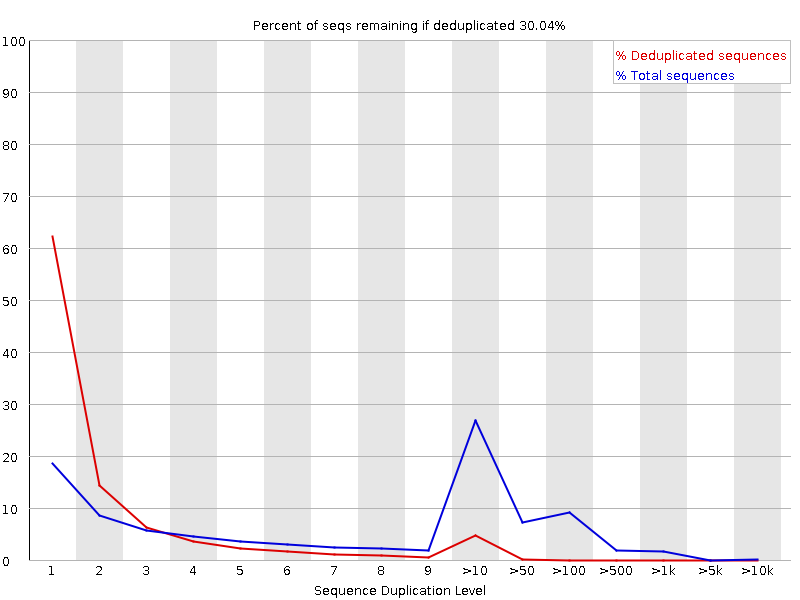
Sequence Duplication Levels
Percentage of reads of a given sequence in the file which are present a given number of times in the file. (This is the blue line. The red line is more difficult to interpret.) There are generally two sources of duplicate reads: PCR duplication in which library fragments have been over represented due to biased PCR enrichment or truly over represented sequences such as very abundant transcripts in an RNA-Seq library. The former is a concern because PCR duplicates misrepresent the true proportion of sequences in your starting material. The latter is an expected case and not of concern because it does faithfully represent your input.
What to expect: For whole genome shotgun data it is expected that nearly 100% of your reads will be unique (appearing only 1 time in the sequence data). This indicates a highly diverse library that was not over sequenced. If the sequencing output is extremely deep (e.g. > 100X the size of your genome) you will start to see some sequence duplication; this is inevitable as there are in theory only a finite number of completely unique sequence reads which can be obtained from any given input DNA sample.
When sequencing RNA there will be some very highly abundant transcripts and some lowly abundant. It is expected that duplicate reads will be observed for high abundance transcripts. The RNA-Seq data below was flagged as Failed by FastQC even though the duplication is expected in this case.
Overrepresented Sequences
List of sequences which appear more than expected in the file. Only the first 50bp are considered. A sequence is considered overrepresented if it accounts for ≥ 0.1% of the total reads. Each overrepresented sequence is compared to a list of common contaminants to try to identify it.
What to expect: In DNA-Seq data no single sequence should be present at a high enough frequency to be listed, though it is not unusual to see a small percentage of adapter reads. For RNA-Seq data it is possible that there may be some transcripts that are so abundant that they register as overrepresented sequence.
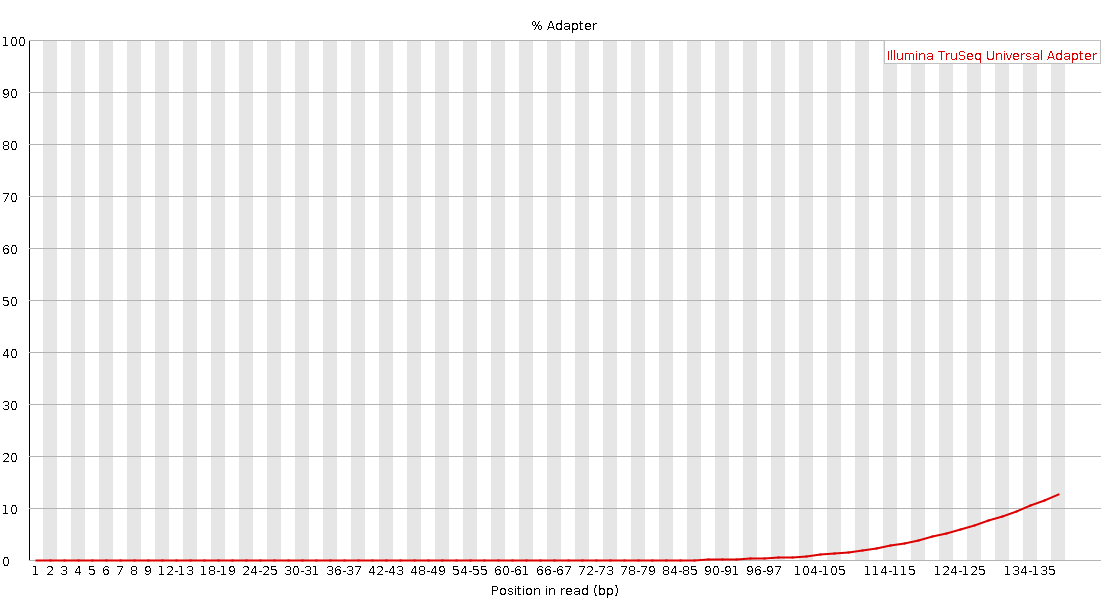
Adapter Content
Cumulative plot of the fraction of reads where the sequence library adapter sequence is identified at the indicated base position. Only adapters specific to the library type are searched.
What to expect: Ideally Illumina sequence data should not have any adapter sequence present, however when using long read lengths it is possible that some of the library inserts are shorter than the read length resulting in read-through to the adapter at the 3’ end of the read. This is more likely to occur with RNA-Seq libraries where the distribution of library insert sizes is more varied and likely to include some short inserts. The example below is for a high quality RNA-Seq library with a small percentage of the library having inserts smaller than 150bp.
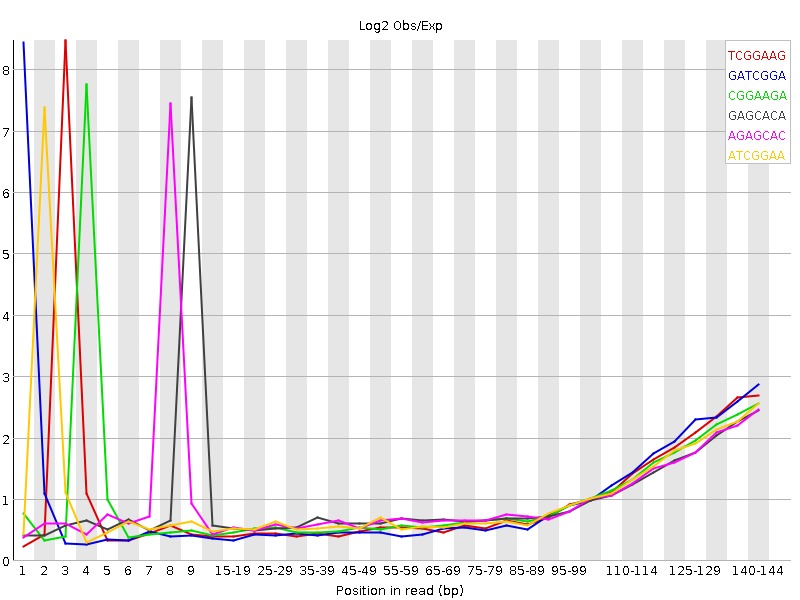
Kmer Content
Measures the count of each short nucleotide of length k (default = 7) starting at each positon along the read. Any given Kmer should be evenly represented across the length of the read. A list of kmers which appear at specific positions with greater than expected frequency are reported. The positions for the six most biased kmers are plotted. This module can be very difficult to interpret. As with the sequence duplication module described above, RNA-seq libraries may have highly represented Kmers that are derived from highly expressed sequences. If you wish to learn more about this module please see the FastQC Kmer Content documentation. The example Kmer content graph below is from a high quality DNA-Seq library. The biased Kmers near the start of the read likely are due to slight, sequence dependent efficiency of DNA shearing or a result of random priming.
FastQC results for alternate library types or libraries with specific problems
Small (micro) RNA
Small RNA libraries typically consist of a relatively small set of unique, short sequences. Small RNA libraries are not randomly sheared before adding sequencing adapters to their ends meaning all the reads for specific classes of miRNA will be identical.
Expected results are:
- Extremely biased per base sequence content
- Extremely narrow distribution of GC content
- Very high sequence duplication levels
- Abundance of overrepresented sequences
- Read through into adapters
Small RNA library FastQC report
Amplicon/metagenomics
Amplicon libraries are prepared by PCR amplification of a specific target, for example the V4 hypervariable region of the bacterial 16S rRNA gene. All reads from this type of library are expected to be nearly identical.
Expected results are:
- Extremely biased per base sequence content
- Extremely narrow distribution of GC content
- Very high sequence duplication levels
- Abundance of overrepresented sequences
- In cases where the PCR target is shorter than the read length, the sequence will read through into adapters
Amplicon library FastQC report
Bisulfite-Seq/BS-Seq/Methyl-Seq
Bisulfite (methyl) Seq libraries have had the majority of the cytosine (C) bases converted to thymine (T).
Expected results:
- Biased per base sequence content
- Biased per sequence GC content
Adapter dimer contamination
Any library type may contain a very small percentage of adapter dimer (i.e. no insert) fragments; these are more likely to be found in amplicon libraries constructed entirely by PCR (by formation of PCR primer-dimers) than in DNA-Seq or RNA-Seq libraries constructed by adapter ligation. If a sufficient fraction of the library is adapter dimer it will become noticeable in the FastQC report.
Expected observations with adapter dimer contamination:
- Drop in per base sequence quality after base 60
- Possible bi-modal distribution of per sequence quality scores
- Distinct pattern observed in per bases sequence content up to base 60
- Spike in per sequence GC content
- Overrepresented sequence matching adapter
- Adapter content > 0% starting at base 1